Know When to Be In the Market — And When to Get Out


Research-backed portfolio and trading systems built by a Finance PhD using tactical market timing, momentum, and volume analysis.


âś” Tactical market timing signals
✔ Live Portfolio models with real stock holdings
✔ Repeatable trading rules + image based set ups with live risk rules and real money steps to implement and start trading. 


[ Follow the Portfolios - Track Recommended Holdings]
[ Learn to Trade Futures Options - $45 Full Breakdown ] 

[Visit the Blog] 


👉 Build My Portfolio System

Used by Investors, Traders and Advisors

All strategies are built from the same research framework and designed to work together.

See what paying customers are saying: 


Priyanka Ranjan, CEO - PiTrade

Pi Trade — an SEC-registered investment platform built by former Goldman Sachs and Amazon executives.

The platform allows users to follow and copy trade the strategies directly.


"Lutey Growth - CAN SLIM & Lutey Quality - Dividend Warren Buffet both outperformed the SP500 from November 2025-January 15 2026. Performance - Buffett Investing: 7% and CAN SLIM: 9%."


Understand the CAN SLIM system - with free stock picks from May 2026 rebalance


 A brief explanation of the CAN SLIM model below. How this system expands on it and improves it. 

The How to Make Money in Stocks CAN SLIM system was developed by William J. O'Neil as a hybrid growth investing framework that combines:

  • earnings growth,

  • sales growth,

  • price momentum,

  • institutional demand,

  • and market trend analysis.

It is designed to identify stocks with the potential for major price advances before large institutional moves fully develop.


What CAN SLIM Stands For

C — Current Quarterly Earnings

Look for companies with:

  • strong recent earnings growth,

  • accelerating EPS,

  • and strong revenue growth.

Typical rule:

  • Quarterly EPS growth of +20% to +25% or more.

The idea:
institutions aggressively buy companies showing sudden earnings acceleration.


A — Annual Earnings Growth

Look for:

  • strong annual EPS growth over multiple years,

  • rising return on equity,

  • improving profitability.

Typical focus:

  • 3–5 years of annual growth consistency.

This helps avoid one-quarter “fluke” companies.


N — New

A stock often needs a “new” catalyst:

  • new product,

  • new management,

  • new technology,

  • new industry trend,

  • or new price highs.

Examples historically:

  • iPhone launch

  • AI adoption

  • Cloud computing

  • EV expansion

CAN SLIM strongly favors companies making new highs rather than “cheap-looking” laggards.


S — Supply and Demand

This focuses on stock float and trading activity.

Key idea:

  • limited supply + strong institutional demand = explosive moves.

Things examined:

  • trading volume,

  • shares outstanding,

  • accumulation patterns.

Volume surges are especially important.


L — Leader or Laggard

Buy market leaders.

Avoid weak stocks simply because they look cheap.

Typical metrics:

  • Relative Strength (RS)

  • industry leadership

  • momentum ranking

The framework heavily favors:

  • top-performing industries,

  • top-ranked stocks within those industries.


I — Institutional Sponsorship

Look for:

  • mutual funds,

  • hedge funds,

  • pension funds,

  • large institutions

accumulating shares.

Institutions drive large sustained trends because they control massive capital flows.


M — Market Direction

Even strong stocks struggle in bad markets.

CAN SLIM emphasizes aligning with:

  • overall market trend,

  • confirmed uptrends,

  • momentum conditions.

This is one of the most important parts of the framework.

Many traders ignore this piece.


How Matt can help you

Learn Value Investing

Trading Techniques and Tactics

Multiple minute - to multiple hour or day set ups 

Longer-term weekly moves to several month trends in stock prices

Spot or identify deep-value opportunities and portfolio tactics for automatically investing in deep value stocks with 30% + upside potential


$500 Portfolio Coaching - Learn to pick stocks in your portfolio using technical analysis.

Click the image above to start. 

Free top 2 patterns + $45 tradebook for intraday trading patterns + options optimal setups. $147 webinar discussing how to implement the top 2 patterns. $750/session one hour coaching to step-by-step learn the process to futures options trading and walk through the exact playbook rules starting with: 

1. How to get started - setting up an account, following the complete strategy -

2. Understanding risk - frameworks from a beginner perspective

3. Introducing profit targets and managing risk levels

4. Start Simulated trading - what to look for in a trade, what time of day to trade, how to double your equity curve ($100,000 -> $200,000 e.g.) in simulated trading.

5. Bridging the gap from simulation to starting live trading.

6. Parsing out your bankroll

7. Understanding your risk tolerance - how much risk you can bet and remain emotionally unaffected. 

8. Remember to go back to small size - e.g. (for example) trading one share - opposed to jumping on options and futures right away. 

9. Avoid pattern day trading by using futures options but understand equities, equity options too and bank roll size needed for each. 

Log in to trade in a small group. Once a week meet with a small group live ($597/session).

Identify patterns + optimal options based on the 'delta' method.

I'll discuss opportunities that relate to the tradebook (playbook) during market hours  (9:30 eastern - 10:30 eastern).

Get Exclusive Market Insights - Discounts - Deals and tips on New and Up and Coming Products

Meet Dr. Matt Lutey

Matt has studied technical analysis and portfolio construction since 2010. Over the last 15 years, he has refined his processes and models, drawing on conversations with mentors and advisors outside the classroom. He received his Ph.D. in Engineering from the University of New Orleans in 2018. He's based out of Atlanta, GA and serves clients locally and nationwide / globally. 

Blending traditional financial planning with modern tools like AI, without losing sight of human judgement. Read more of matts story https://www.drmattlutey.com/about 

Want excess portfolio performance with less rebalancing?
View the 10-stock portfolio outperforming the SP500 — with low annual turnover.

👉 Get the portfolio with SP500 stocks

1999-2026
Performance data

  • Annualized return vs SP500, 
  • last month, 
  • last three months, 
  • last year, 
  • last three years, 
  • last five years, 
  • over all - 

 See How We Structure Portfolios For Clients Like You. 

Rules based approach to investing - with historical validity and point-in-time survivor-bias free data from sources like Standard and Poor's Compustat and FactSet via Portfolio123.com. Dr. Lutey research offers repeatable analytical investing for modern day portfolio managers. 

Portfolio Types
Free Trading Playbook

Get My 2 Favorite Trade Setups For under $30,000 Accounts

Free preview from my personal tradebook showing the exact entries, exits, and risk rules.

Get My Free Trade Setups

How we work / simple process

  1. 15‑minute call to understand your goals and current portfolio
  2. Portfolio analysis: risk, costs, diversification, alignment with your goals
  3. Clear recommendations: what to keep, what to change, and why

30-minute consulting call. 1 on 1. Portfolio review or general overview q/a consulting call. 

About Matt

Matt is a finance PhD (University of New Orleans, 2019) and professor. He builds models that track best performing stocks based on fundamental and technical properties that show the strongest fundamental and momentum properties with a proven track record of out performance. He builds university classes that meet the students at their level and brings them through the material through learning by doing. 

The site is an education platform that shows portfolio strategies that outperform the market historically, recession signals, day-trading strategies, investment courses and financial modeling courses. Key takeaways are: 

  • 15 years of research experience and building models that outperform the market. 
  • Applications that show the models continue to outperform in real time after publication.
  • Data used with point-in-time survivor-bias free estimates from the Center for Research in Security Prices (CRSP) and Fact Set via Portfolio123.com.


Dr. Lutey Investment Education Platform

Learn the tools used to pass undergraduate Corporate Finance, Investments, Valuation, International Finance and advanced - masters level (MBA - M.S. Finance) Corporate Finance / Valuation. Certificate included with a 70% pass in each module. 

Learn a variety of modules 6-8 modules per class with core concepts related to each subject - taught by subject expert Matt Lutey Ph.D. course fees range from $500-$1500. 

Contact me by E-mail me using the contact e-mail address provided: https://www.drmattlutey.com/contact

Explore Investment Education

A brief message

I believe you can beat the market. I take on the heavy costs—both the data and the time required to conduct the research—so that you don’t have to. By subscribing to the monthly portfolio, you gain access to the results of these studies in real time and can see your outperformance firsthand. Whether you’re an individual investor, a student-managed fund, or a financial planner, there’s a place for you here—regardless of background or experience.


AS SEEN IN:

Hi, I’m Matt Lutey. I’m on a mission to bridge the gap between academic finance and real-world practitioner finance..

Since 2019, I’ve taught undergraduate and MBA-level finance courses at multiple universities, covering corporate finance, investments, valuation, and two student-managed investment fund programs. My goal is to bridge the gap between academic theory and practical finance—helping students think like practitioners while grounding real-world decision-making in research-based principles.

 What would you do if you knew which stocks were about to rise—before they did?

In my classes, we explore that question through hands-on projects that replicate the methodologies of the world’s most successful investors. Students learn to build and test portfolios based on proven frameworks and to identify the characteristics that stocks often display before making major upward moves.

 This website serves as an intersection between practical finance and academic research. It’s built for those who’ve ever read a finance paper and thought, “How can I rebuild that study—and capture the benefits of running it in real time?”

 Here, you’ll find insights on how to:

  • Identify which stocks are most likely to outperform (or which options to buy before they rise).
  • Preserve wealth while achieving higher returns with lower risk than the overall market.
  • Recreate and follow research-backed portfolio strategies with transparent, real-time results.

My research and teaching are dedicated to answering these questions—and this platform provides the tools, data, and frameworks to put them into practice

INTRODUCING

Famous Investor Portfolios

CAN SLIM Research

Since 1999, the CAN SLIM, Warren Buffett, Benjamin Graham, Joel Greenblatt, Simplified CAN SLIM, and VPCI portfolios have consistently outperformed the S&P 500. Track them in real time on this platform or through the Dr. Lutey Research app on Android and iOS.

If you want to take it further, you can learn technical analysis methods to improve these results and apply them—using options and futures—to build even more advanced portfolio strategies.

Capital Weighted Volume

The famous investor portfolios (with Capital Weighted Volume 'CWV') have proven to beat the Sp500 since 1999 and offer higher return (more than double the Sp500 average return) with lower risk and lower maximum drawdown. This is a hard combination to achieve. You can follow them here, explicitly designed for high-net-worth investors and professional financial planners.

Featured in: "Capital Weighted Volume, Volume Price Confirmation, and Famous Investor Portfolios"

M Lutey
The Journal of Investing (2025)
 
These are the product of one on one work with Buff Dormeier, CMT for Capital Weighted Volume and Portfolio123.com for combining it with the Famous Investor Portfolios. These offer a unique combination of both high return and low risk which is difficult to match. Built exclusively with the risk-averse high-net worth client or financial planner managing those clients assets in mind. Coaching call included with access. 
 
Our case study shows the Famous Investor Portfolios of CAN SLIM, Benjamin Graham, Warren Buffet, Joel Greenblatt and a Capital Weighted Volume + VPCI Technical only portfolio beat the SP500 from 1999-2025. Industry professionals confirm these results. See Below: 
 
 
Invest Now

Invest in University Style Classes

Comprehensive solution for universities looking to enhance their finance curriculum. The courses demonstrate the practical, real-world applications of finance and prepare students for careers in the field.

 What Can University Courses Do for You?

Ever wanted to learn practical investing—not just theory?

Whether you studied art, history, or finance ten years ago, these courses are designed to meet you where you are. They provide the tools, structure, and real-world application to help you build financial understanding step-by-step. 

Predicting the Economic Cycle

The Lutey Recession Indicator combines two of the most powerful signals in finance—the yield curve and the moving average death cross—to identify prior and potential U.S. recession periods with high accuracy.

Subscribers receive quarterly newsletter updates covering:

  • The current state of the recession signal
  • Key stocks and sectors to follow
  • Strategic positioning ideas across stages of the business cycle

From Classroom to Application 

Learn to create and apply strategies developed in university-style finance courses—and put them into practice through real-time analysis. Build on the Famous Investor Portfolios by integrating the top-performing stocks according to the current stage of the business cycle.

For longer-term investors, you can enhance these results by incorporating bonds into a balanced 60/40 retirement portfolio, optimizing both growth and stability. 

The Bigger Picture

 Understand the relationship between the U.S. housing market, the stock market, and potential joint recessions. Learn the econometric steps to track these relationships—alongside the same everyday tools economists use to gauge recession risk.

  1. These resources give you access to the same tools, models, and insights used by professionals—helping you improve your financial decision-making and grow your wealth, regardless of your background or experience level.

Stay-up-to-date on valuable content delivered directly to your inbox--join our community today!

Thank you for Signing Up!

Top Services: 

Famous Investor Portfolios

Invest in the famous investor portfolios. Monthly Subscription. 30-day money-back guarantee. Automated delivery through the iOS app 'Dr Lutey Research' and Android. 

The research is backed by two recent publications: 

"Towards a Simplified Can Slim Model"

T Mukherjee, M Lutey
Applied Finance Letters 12 (1), 44-54


"Does Volume Price Confirmation Indicator Improve Famous Investor Models"

M Lutey
Journal of International Finance and Economics 24 (4), 29-39


Check them out

Trading Courses

Master the market with trades that last 1-5 days, leveraging insights from over a decade of experience.

A recent case study demonstrates that $1,000 in risk generated $4,000 in profit in a few hours. - Matt Lutey, PhD 

Community access for traders to share tips and ideas, and a coaching call is included. The course provides insights and specific rules for scaling and growing an account. 

Check them out

 Showcase Your Results 

Share your success. Display historical backtested results, current passing stocks, and real-time portfolio performance to demonstrate how proven strategies translate into measurable outcomes.

Whether you’re managing your own capital or building credibility as an independent trader, you can showcase your performance and portfolio decisions with clarity and confidence.

Highlight your options trades, illustrate your stock-picking skill, and show the data to back it up—all powered by transparent, research-based models.

Seamless Access

Stay connected to your courses, newsletter insights, and model updates through the iOS app, giving you direct, mobile-friendly access to everything you need—anytime, anywhere.

Stay-up-to-date on valuable content delivered directly to your inbox--join our community today!

Subscribe to Monthly Stock Picks

Already received the free stock pick and want more? Subscribe to our monthly newsletter. 

Apply technical analysis to CAN SLIM Insights

Stock Picks with Options

How CAN SLIM Is Used

The system is generally used as:

Step 1 — Screen for Candidates

Investors screen thousands of stocks using:

  • EPS growth,

  • sales growth,

  • RS ranking,

  • industry strength,

  • volume behavior,

  • new highs.


Step 2 — Analyze Charts

Technical analysis is heavily integrated.

Common concepts:

  • breakouts,

  • bases,

  • consolidation patterns,

  • volume confirmation,

  • moving averages.

CAN SLIM is NOT purely fundamental investing.

It is a hybrid:

  • fundamentals + momentum + technical analysis.


Step 3 — Buy on Confirmation

Instead of buying falling stocks,
CAN SLIM investors usually buy:

  • breakouts,

  • strength,

  • confirmation moves.

This differs from traditional value investing.


Step 4 — Manage Risk

Sell rules are critical.

Typical rules:

  • cut losses quickly,

  • avoid large drawdowns,

  • rotate into stronger names.

Many implementations use:

  • 7–8% stop-loss rules,

  • moving average signals,

  • relative strength deterioration,

  • volume weakness.


Why CAN SLIM Became Popular

Historically, the framework identified many high-growth winners early in their advances.

Examples often associated with CAN SLIM-style traits:

  • Apple

  • NVIDIA

  • Amazon

  • Microsoft

before or during large institutional growth cycles.


Main Criticism of CAN SLIM

The strategy can:

  • underperform in sideways markets,

  • suffer during sharp reversals,

  • experience whipsaws,

  • buy “expensive-looking” stocks,

  • and rotate frequently.

That is why many modern implementations add:

  • tactical timing overlays,

  • macro filters,

  • moving averages,

  • relative strength filters,

  • or volume indicators.

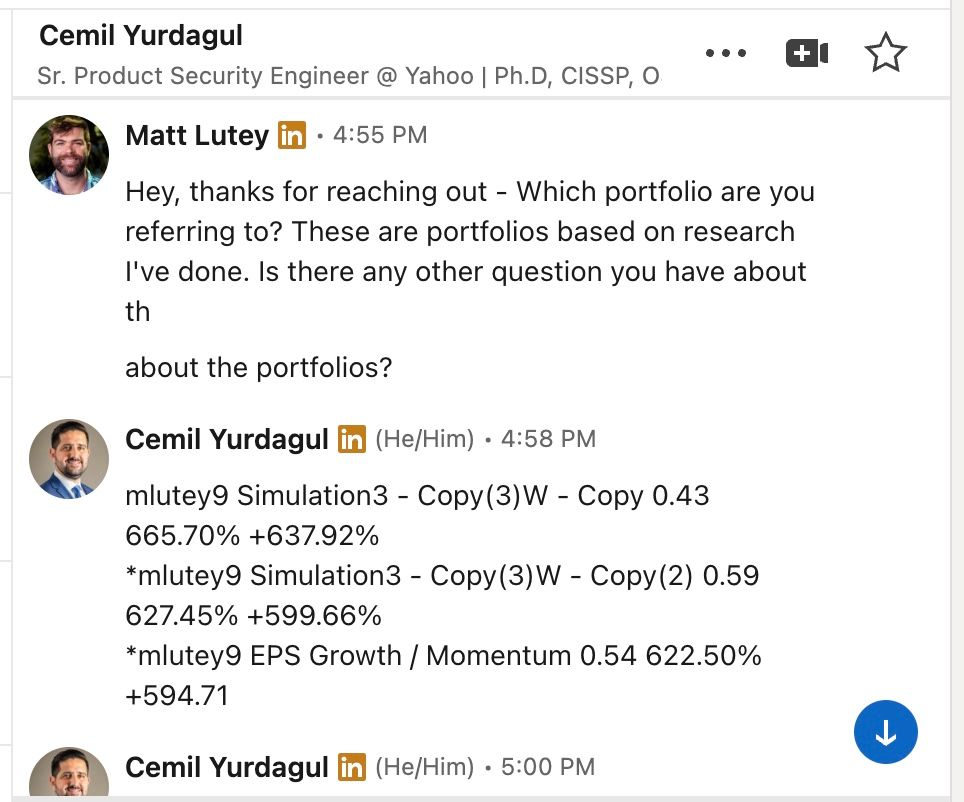
For example, your own research emphasis using:

  • VPCI,

  • MA10 tactical rules,

  • and defensive allocation overlays

is essentially an attempt to improve the original CAN SLIM framework’s:

  • risk management,

  • market timing,

  • and drawdown control.

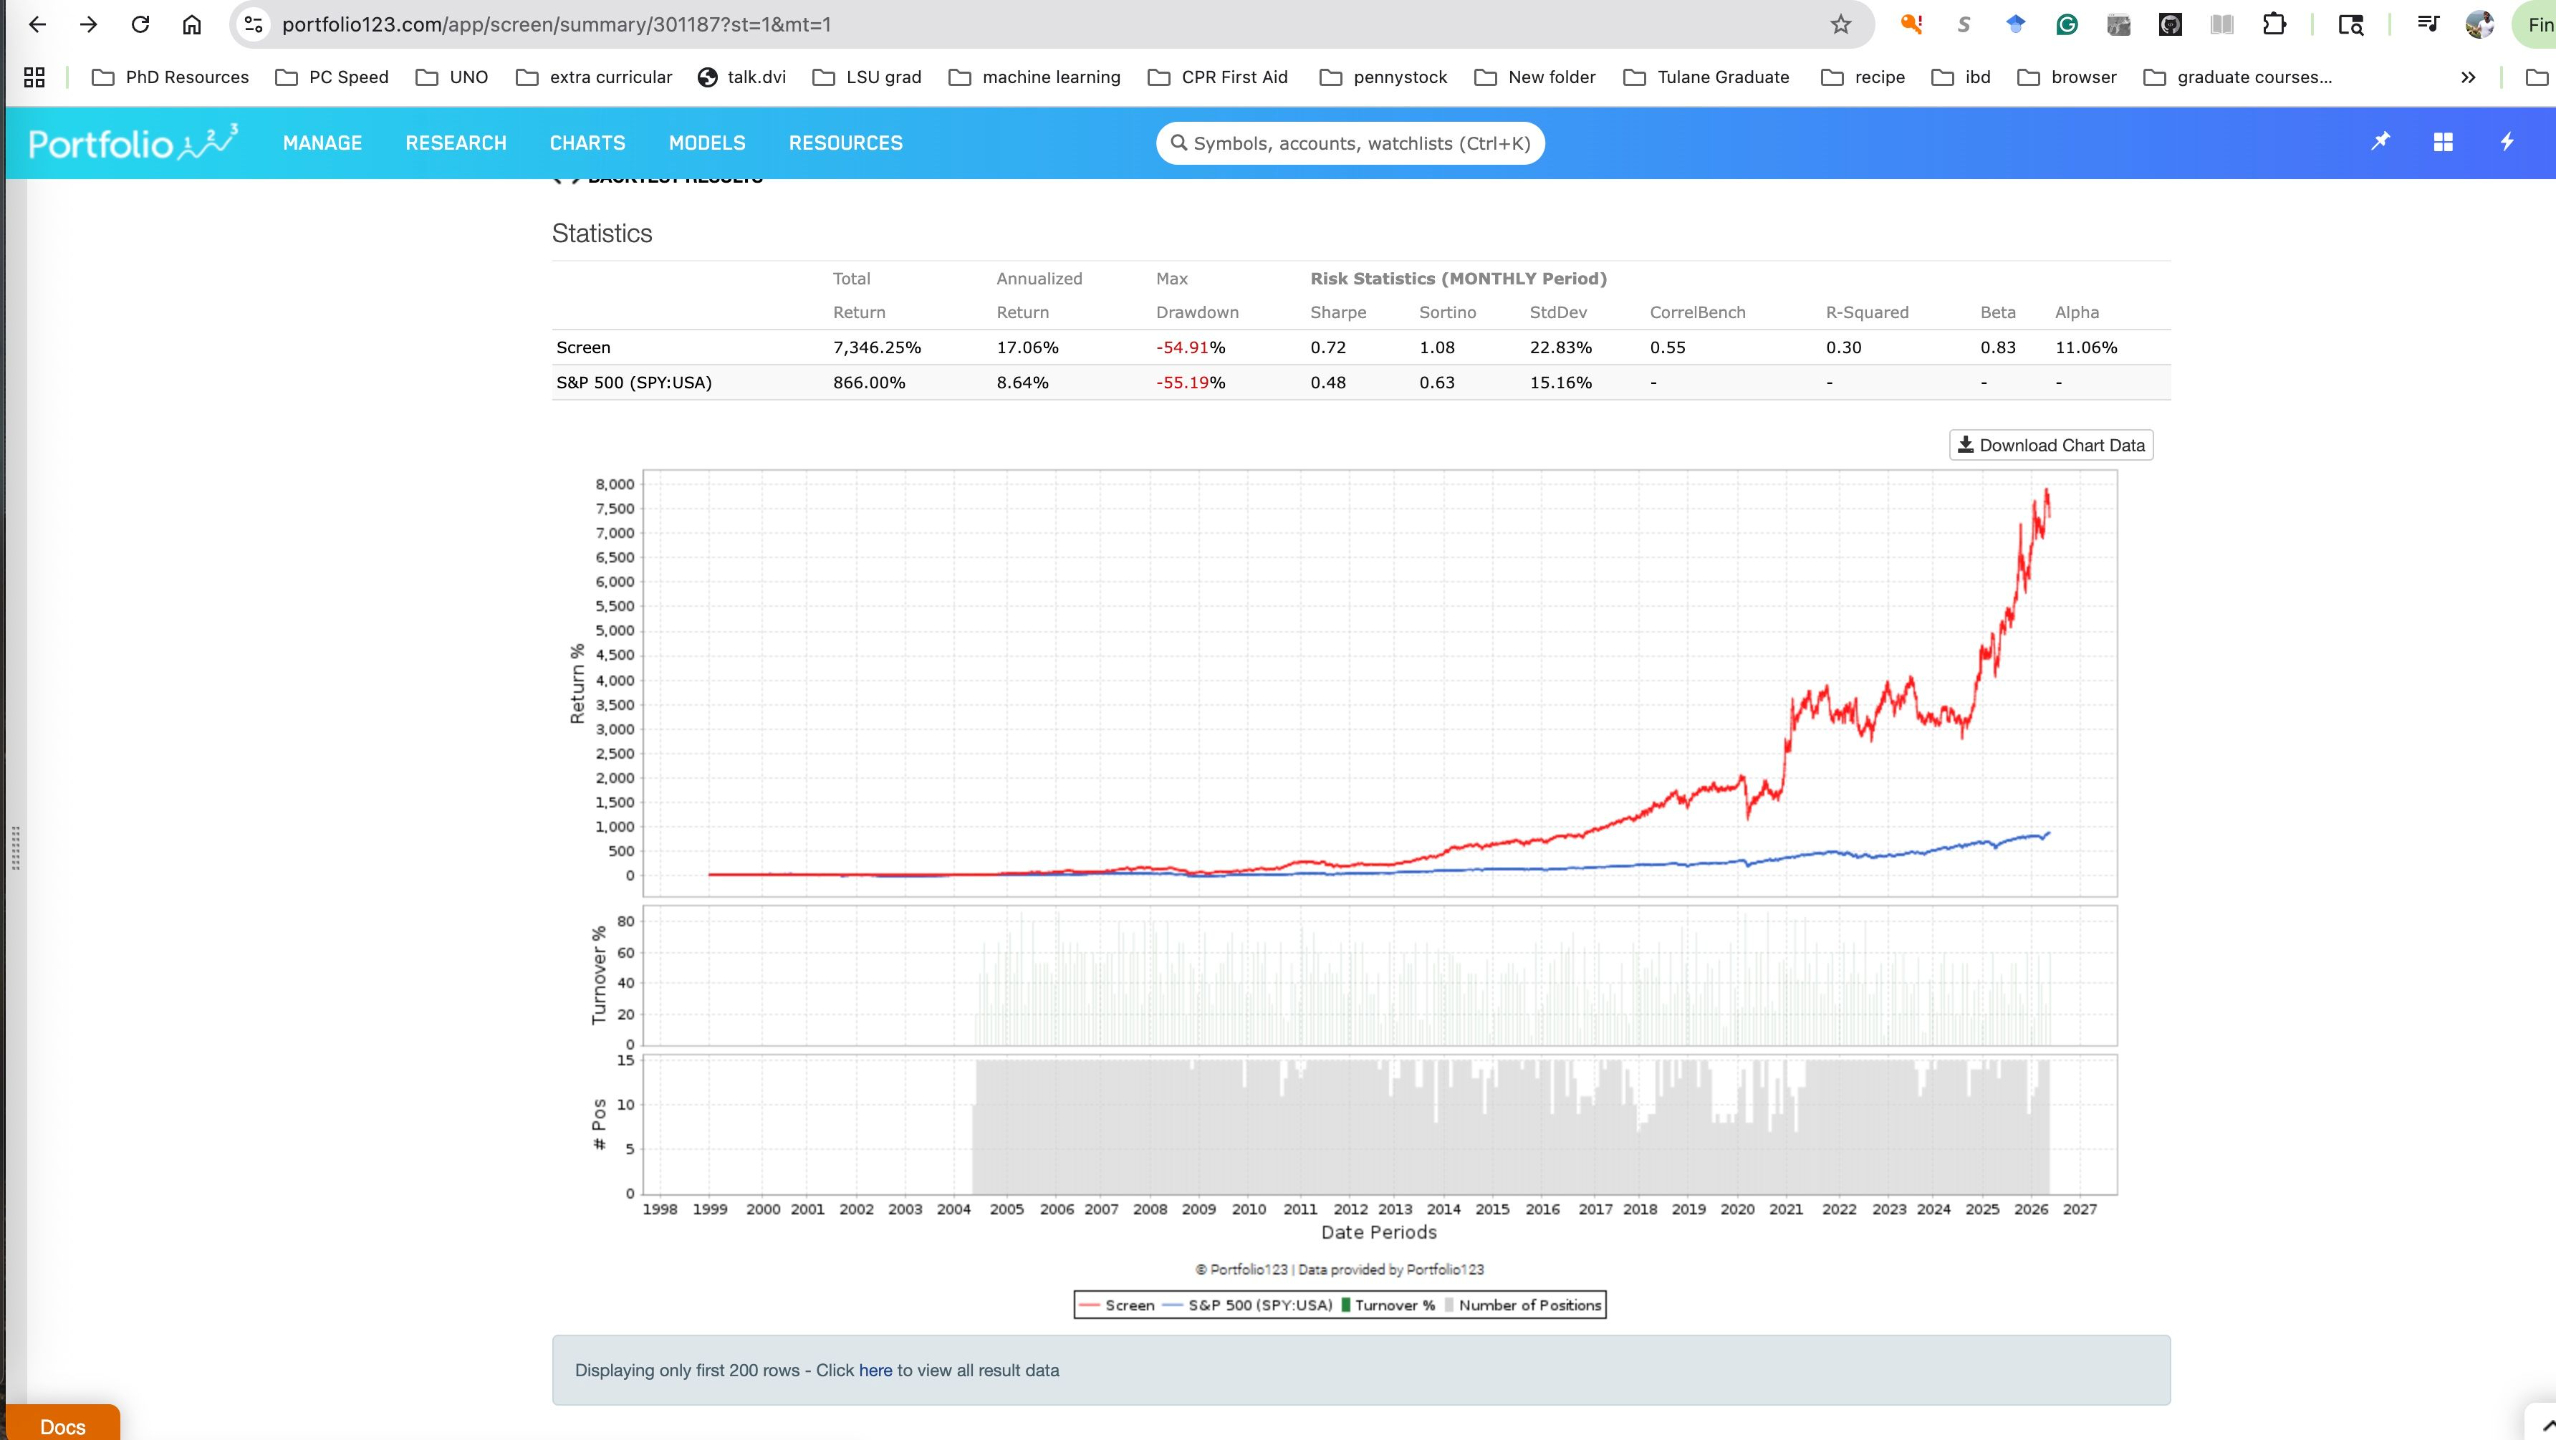
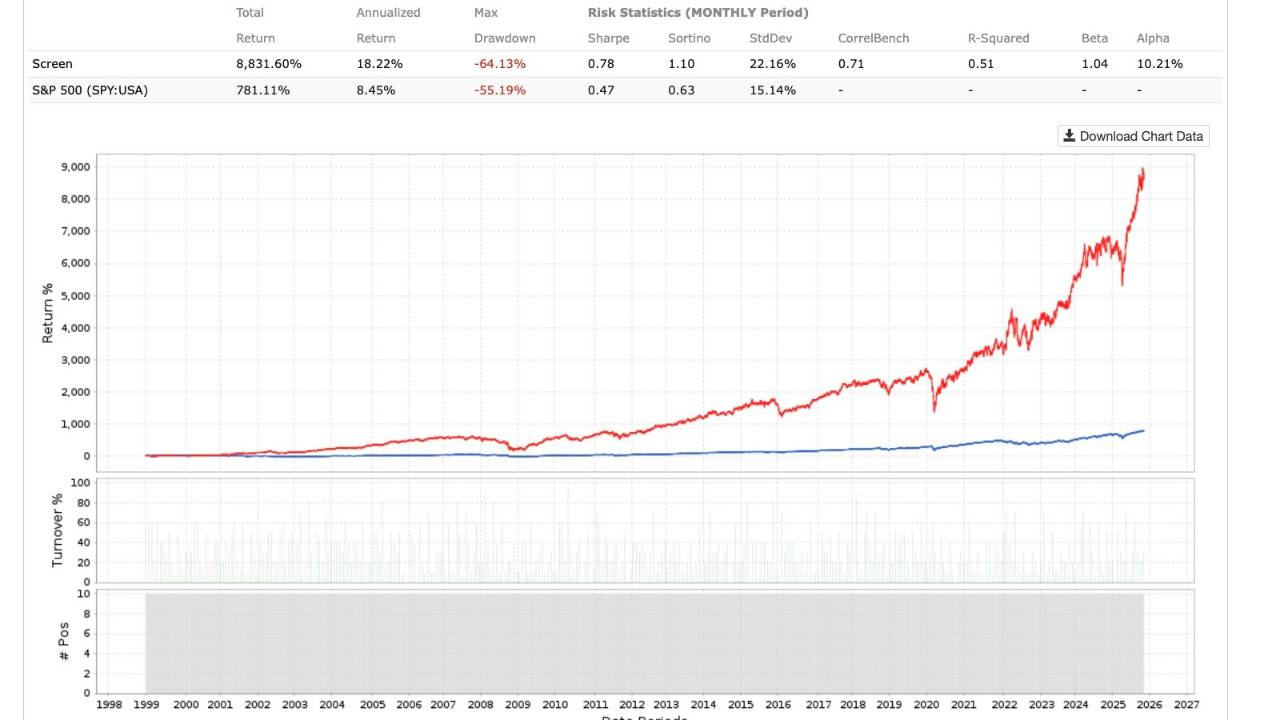
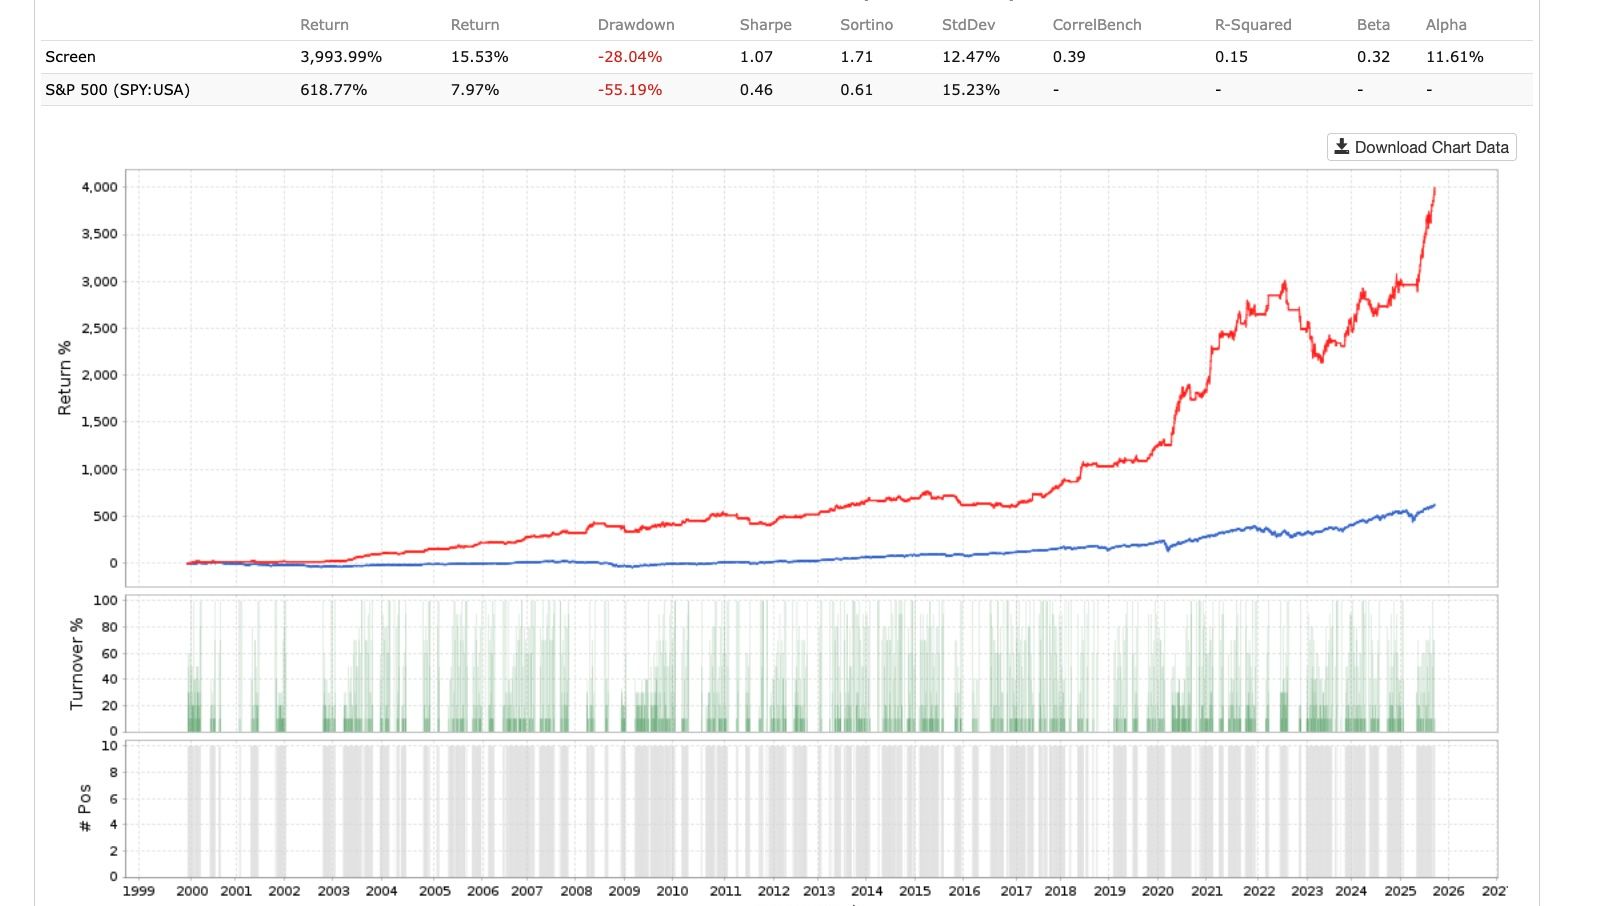
 A sample rebalance following the CAN SLIM system for May 19 2026 - the most recent rebalance. See below the passing stocks and return and risk interpretation going back to 1999 and compared to the overall U.S. stock market Sp500 - (interpretation from Chat-GPT):

This portfolio appears to be a high-momentum, tactical CAN SLIM–style strategy with active rotation and ranking logic, likely integrating:

  • relative strength,

  • momentum persistence,

  • volume confirmation,

  • and tactical replacement of weakening holdings.

The results show a classic “high-upside growth rotation” profile rather than a low-volatility defensive strategy.


Interpretation of the Equity Curve

The red equity curve substantially outperforms the benchmark over the full test period.

From the statistics table:

Metric Strategy S&P 500
Total Return 7,346% 866%
Annualized Return 17.06% 8.64%
Max Drawdown -54.91% -55.19%
Sharpe Ratio 0.72 0.48
Sortino Ratio 1.08 0.63
Std Dev 22.83% 15.16%
Beta 0.83 —
Alpha 11.06% —

Why the Higher Standard Deviation Is Acceptable

At first glance, critics may focus on:

  • the higher standard deviation (22.83%),

  • and the aggressive equity curve.

However, standard deviation alone is often misleading for high-growth strategies because it penalizes:

  • upside volatility,

  • and downside volatility equally.

That creates a major issue for growth investing.

A strategy experiencing explosive upside momentum will naturally produce:

  • larger return swings,

  • stronger accelerations,

  • and higher volatility measures.

But not all volatility is bad.


The Importance of the Sortino Ratio

The Sortino Ratio improves on the Sharpe Ratio because it isolates:

downside deviation only

rather than:

  • upside + downside together.

This is important because investors generally:

  • want upside acceleration,

  • while avoiding downside instability.

The strategy’s:

Sortino Ratio = 1.08

versus

S&P 500 Sortino Ratio = 0.63

suggests the portfolio generated substantially better returns relative to harmful downside volatility.

In other words:

the additional volatility appears to come disproportionately from:

  • upside expansion,

  • momentum surges,

  • and asymmetric positive returns

rather than destructive downside instability.


Why Maximum Drawdown Matters More Here

For tactical growth systems,
maximum drawdown is often the more practical risk metric.

Why?

Because it measures:

  • the actual peak-to-trough capital decline
    an investor would experience psychologically and financially.

Here:

Metric Strategy S&P 500
Max Drawdown -54.91% -55.19%

This is extremely important.

Despite producing:

  • nearly double the annualized return,

  • and massively higher cumulative return,

the strategy experienced a drawdown profile roughly consistent with the broader U.S. equity market.

That means the system:

  • did not require materially worse downside pain
    to generate the excess returns.


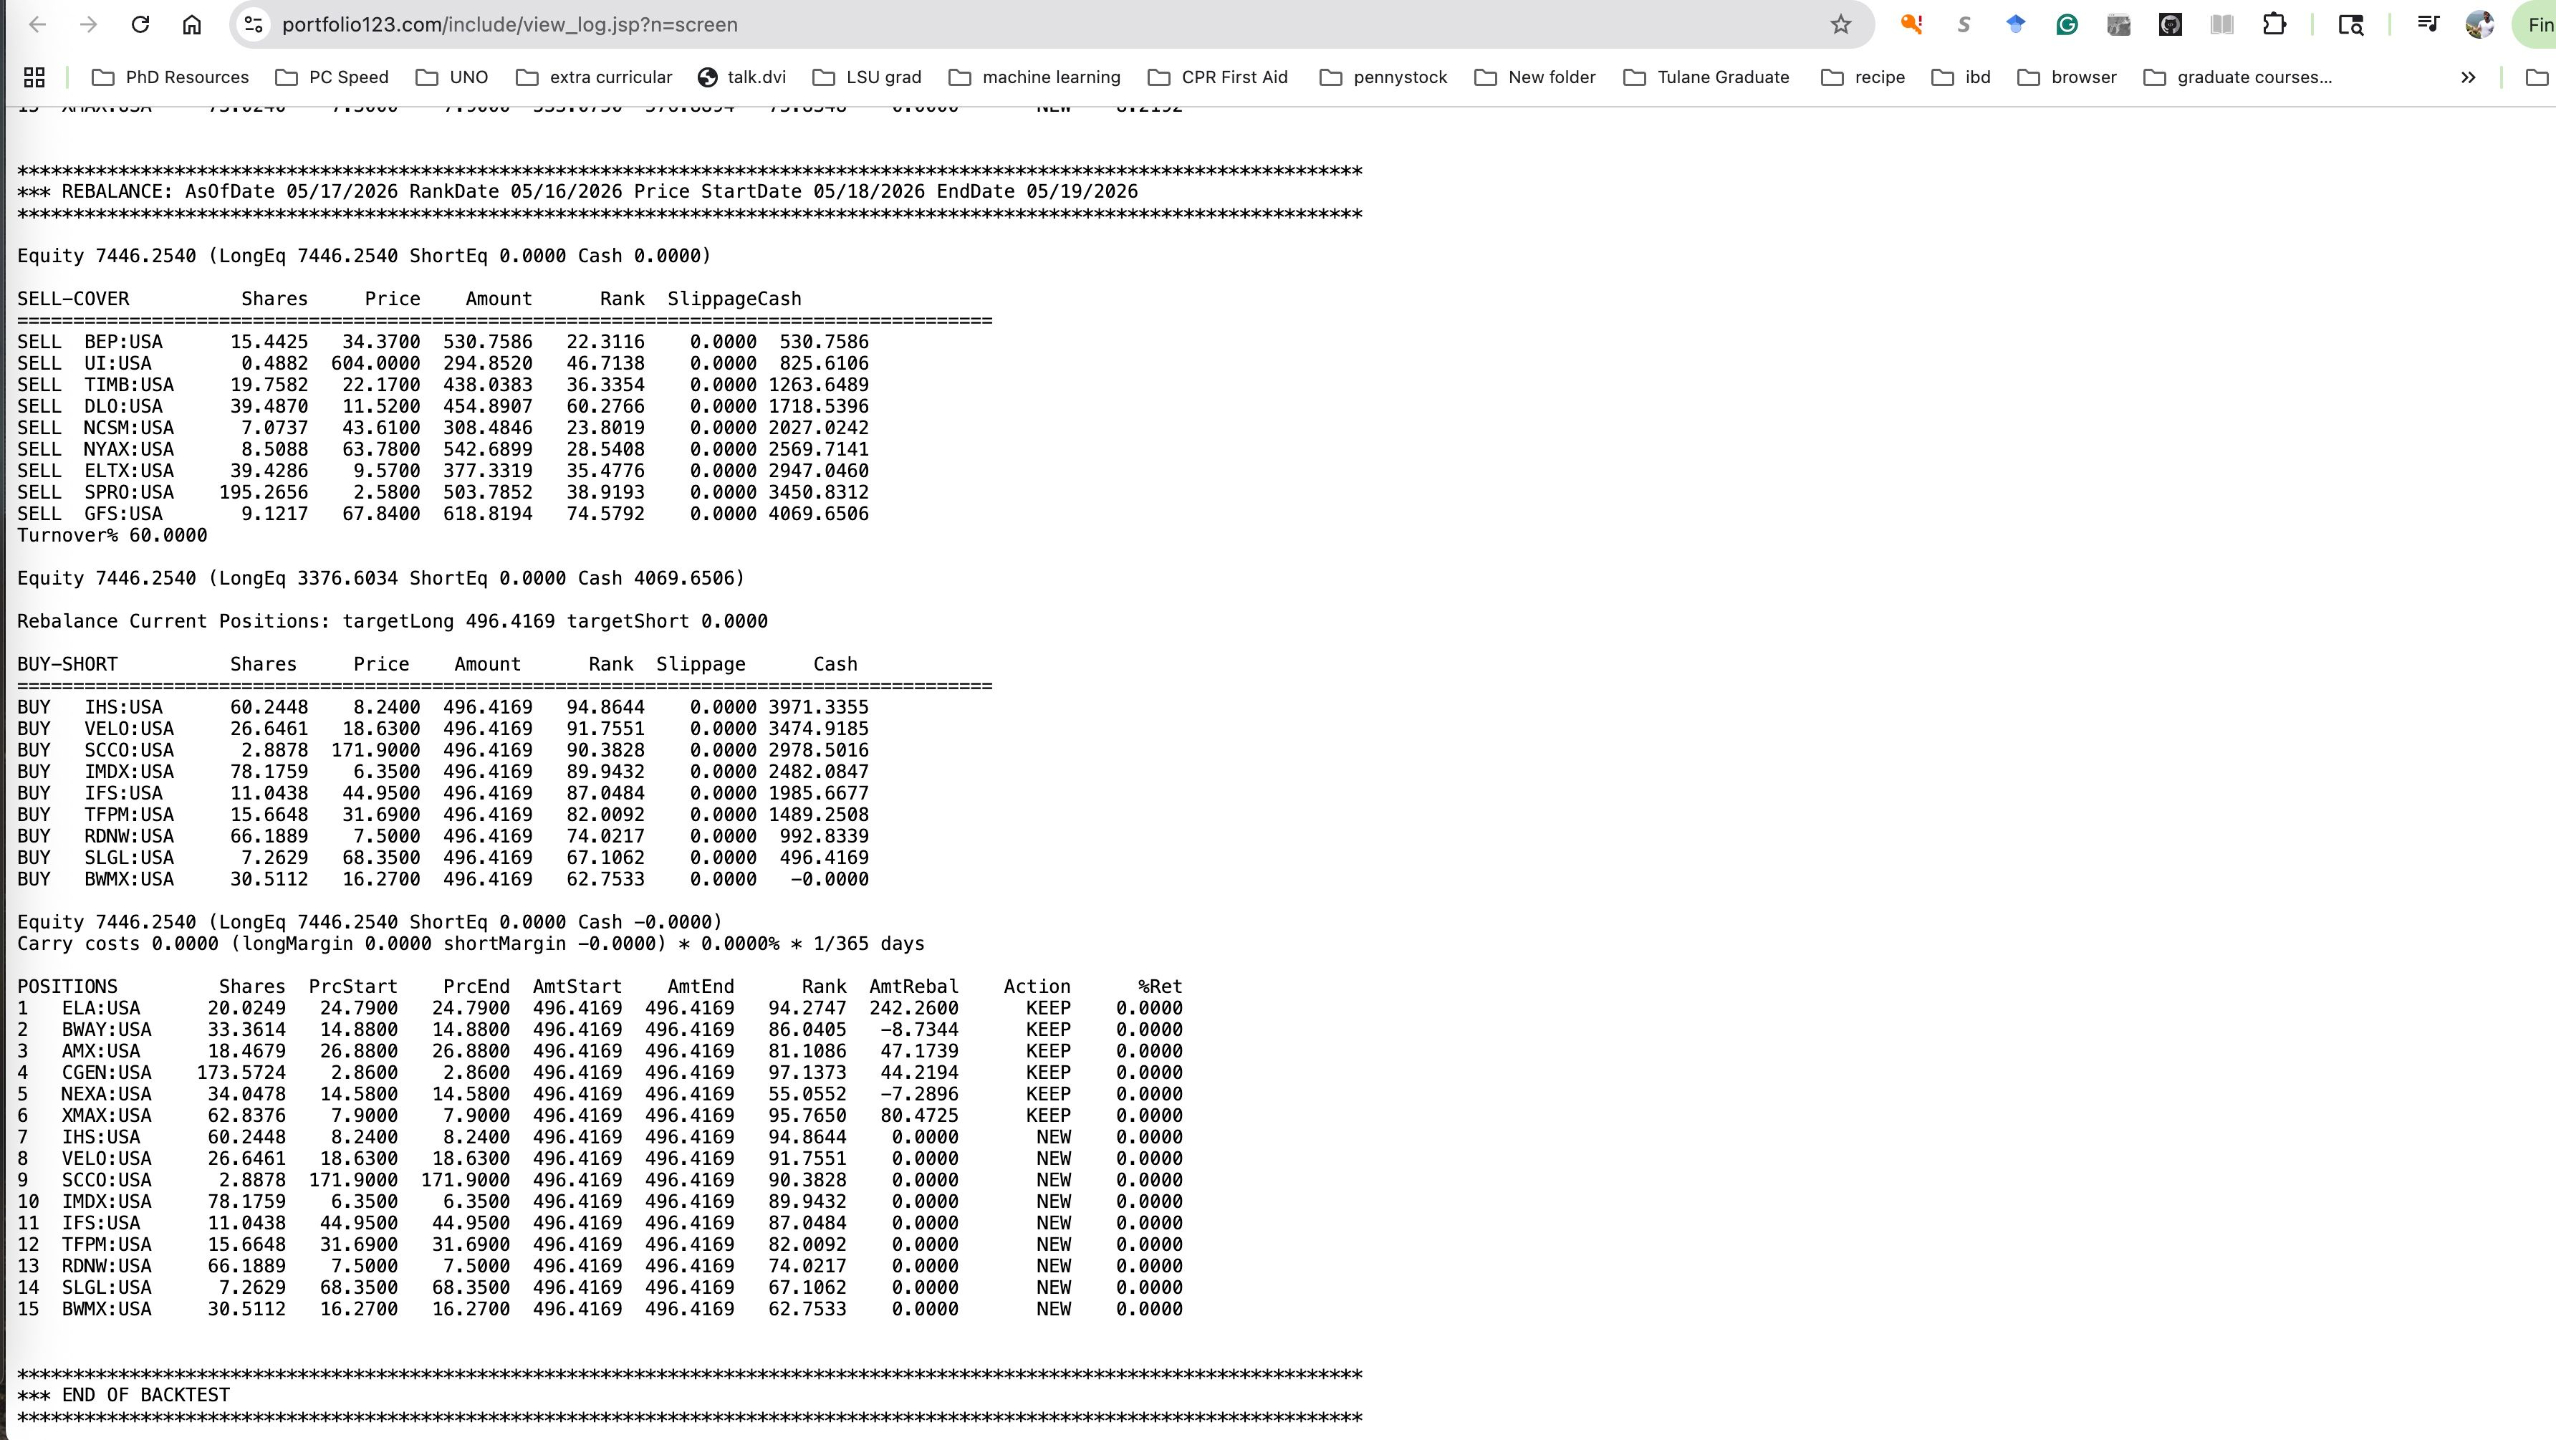
Interpretation of the Passing Stocks

The rebalance log shows active replacement of weakening holdings with stronger-ranked momentum names.

Stocks sold included:

  • weaker relative strength transitions,

  • deteriorating rank positions,

  • or likely failures of the momentum/technical confirmation process.

New additions included names such as:

  • IHS

  • VELO

  • SCCO

  • IMDX

  • IFS

  • TFPM

  • RDNW

  • SLGL

  • BWMX

while several stronger holdings remained:

  • ELA

  • BWV

  • AMX

  • CGEN

  • NEXA

  • XMAX

This suggests the model is operating as a:

  • dynamic ranking system
    rather than a passive buy-and-hold allocation.


What the Rebalance Suggests About the Strategy Logic

The rebalance behavior implies:

  • stocks are continuously ranked,

  • lower-ranked names are removed,

  • capital rotates into improving momentum candidates,

  • and technical persistence is rewarded.

The turnover (~60%) confirms the strategy is:

  • tactical,

  • adaptive,

  • and responsive to changing leadership.

This is consistent with:

  • CAN SLIM principles,

  • relative strength investing,

  • and momentum rotation systems.


Risk Interpretation

This is not a low-volatility strategy.

It is a:

high-upside tactical growth strategy

designed to:

  • maximize asymmetrical upside participation,

  • while maintaining drawdown behavior comparable to the broad market.

The key evidence supporting that interpretation is:

  • higher Sortino ratio,

  • higher Sharpe ratio,

  • lower beta than expected (0.83),

  • and maximum drawdown nearly identical to the S&P 500 despite vastly higher returns.

That combination suggests:
the strategy historically generated superior upside capture efficiency rather than simply taking reckless downside risk.


Overall Interpretation

The portfolio appears to demonstrate:

  • successful long-term momentum capture,

  • tactical rotation into market leadership,

  • effective replacement of deteriorating holdings,

  • and strong upside asymmetry.

The most important statistical takeaway is likely:

The strategy generated materially higher compounded returns without materially worsening maximum drawdown relative to the S&P 500, while the elevated standard deviation appears largely attributable to upside volatility — reflected in the stronger Sortino Ratio.

The stocks are from the NYSE (New York Stock Exchange) AMEX (American Mercantile Exchange). The SP500 portfolios are on https://www.drmattlutey.com/store Â