Lutey Recession Timing Indicator
The thesis of Lutey Recession Indicator
The Lutey Recession Indicator aims to predict recessions and forecast how long they will last.
It's based on the principle that interest rate inversions typically precede a recession due to market uncertainty. Recessions usually bring a sharp sell-off in stock prices, leading to a moving average crossover. The Lutey indicator combines these two concepts into a single recession timing tool.
Fama and French (2019) cover the lack of ability of interest rate inversion to forecast a recession and Lutey and Rayome (2020) cover combining both interest rate inversion and moving average crossover signals to improve timing prior to the historical recession periods.
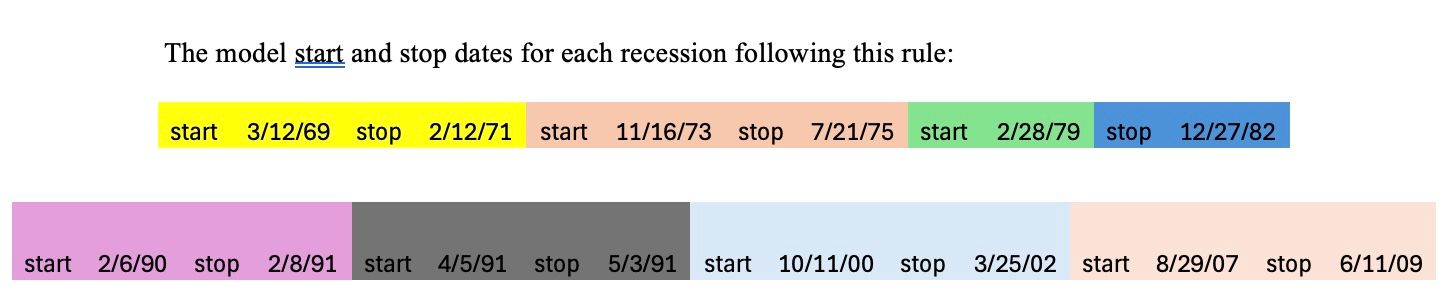
Lutey Recession Indicator exits the market when daily moving average 21 is below daily moving average 200 on the SP500 index and interest rates have been inverted for at least three consecutive months prior to the crossover. The indicator was applied to the historical recession periods starting in 1969 through 2008. The interest rates used are 1 year 5 year and 1 year 10 year, when one of those are inverted for three consecutive months Lutey Recession indicator exits the market following a 21 day 200 day moving average cross. The indicator stays out of the market for as long as the moving average crossover is valid, or the length either of the rates were inverted prior to the crossover starting 272 days prior to the crossover, plus any new rate inversions that occured during the crossover, or new crossover that occured after new rate inversion.
Rules to Re-Enter the market
Lutey Recession Indicator will only re-enter the market when:
- The MA crossover has ended,
- No yield curves are inverted from the 272 day offset prior to the MA cross,
- And no new inversions have occurred while the signal was active
At that point, stop monitoring for signals—the recession risk has likely passed.
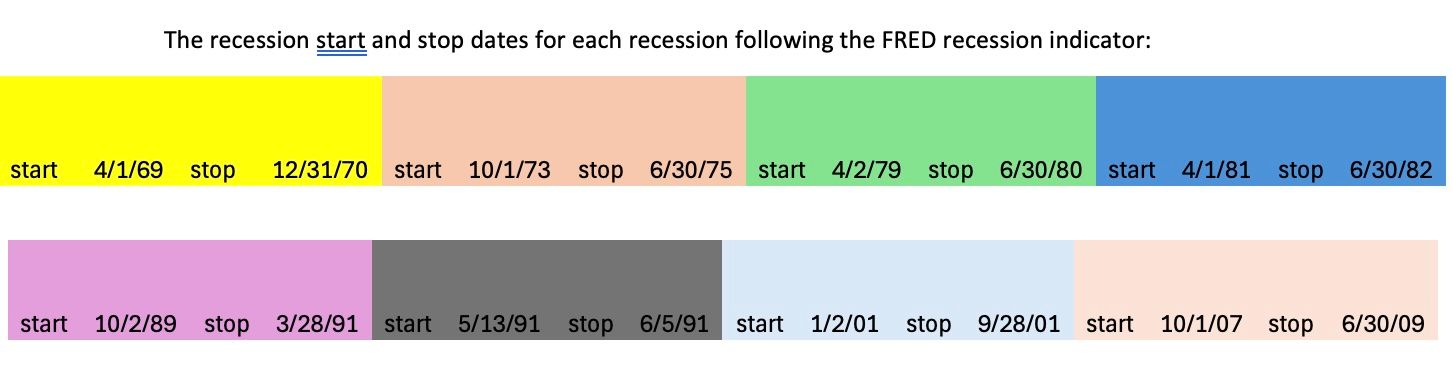
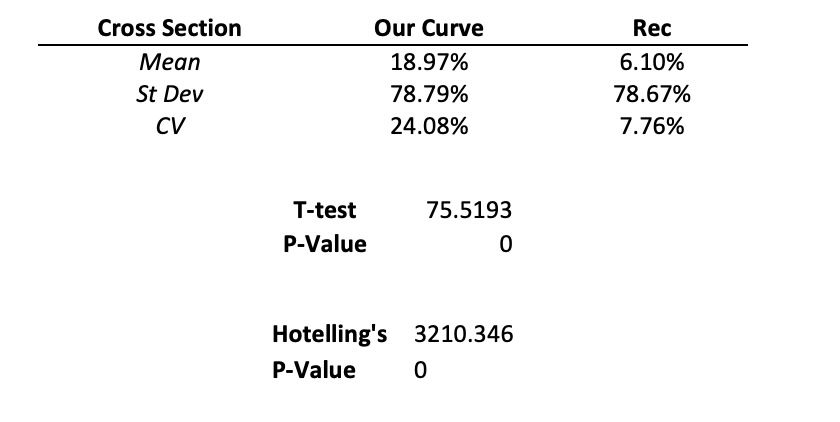
CRSP Study
This rule, when applied to every recession since 1969 using the Center for Research in Security Prices (CRSP) database, yields the following statistics:
Applied to CAN SLIM
Applying the recession rule to the SP500 and the Famous Investor CAN SLIM Portfolio from 2000-2025 and applying the model to both the SP500 and CAN SLIM during the 2008 recession. The CAN SLIM study starts in 2004 so it is not exposed to the 2001 recession.

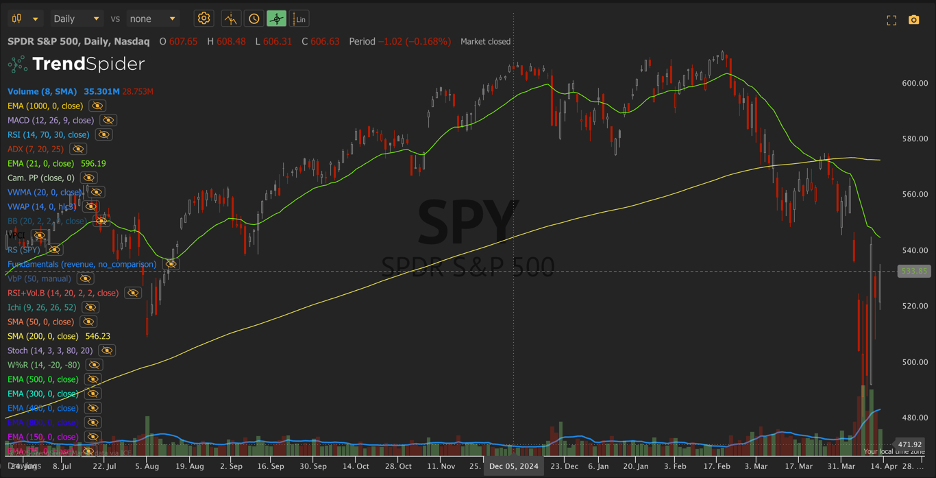
Yield Curve Inversion + MA Crossover
SP 500 observed a moving average (MA) crossover of 21 day and 200 day moving averages on the daily index around March 25, 2025. Prior to this, interest rates were inverted for most of 2023 and 2024.
In this case, the relevant inversion period (272 days before MA crossover) begins on March 4, 2024. You would remain out of the market for the entire duration of that inversion and continue to stay out if the MA crossover is still active or if new rate inversions occur.
The rate inversion began on March 4, 2024, and persisted until December 2024. Since then, the yield curves have been intermittently inverting. This means you should monitor both the 1-year/5-year and 1-year/10-year yield curve inversions, along with any new ones that may arise.
The rates resumed to normal for 49 days starting 12/13/2024. So monitor the market for the length of the moving average crossover or a second moving average crossover if the moving average resumes to normal.
The rule is as follows: when rates are inverted for 3 consecutive months look for a moving average crossover. Then stay out of the market for as long as either (1) the MA crossover remains valid, or (2) rates were inverted starting from 272 days before the crossover.
The current state would be to stay out of the market following the moving average crossover signal or 197 days starting when the moving average crossed over.
Lutey Recession Indicator will monitor the state of the market and post an update after the 197 day consecutive rate inversion period is over and follow either any new moving average crossovers that have occured then or new rate inversion periods until no rates are inverted or moving averages are crossed over.
Interest Rate Inversion
This spreadsheet shows the rate inversion from 4/7/2025 back until 2/26/2025 after a brief 49 day period of no inversion from 12/13/2025. This data is available from the treasury website (link below).

Video of Current Market Conditions
Video covering the 2020 paper and current interest rate inversion and moving average crossover.
2025 Video